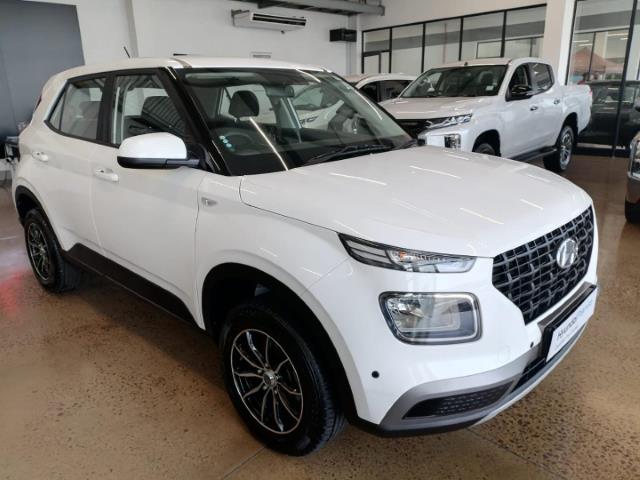
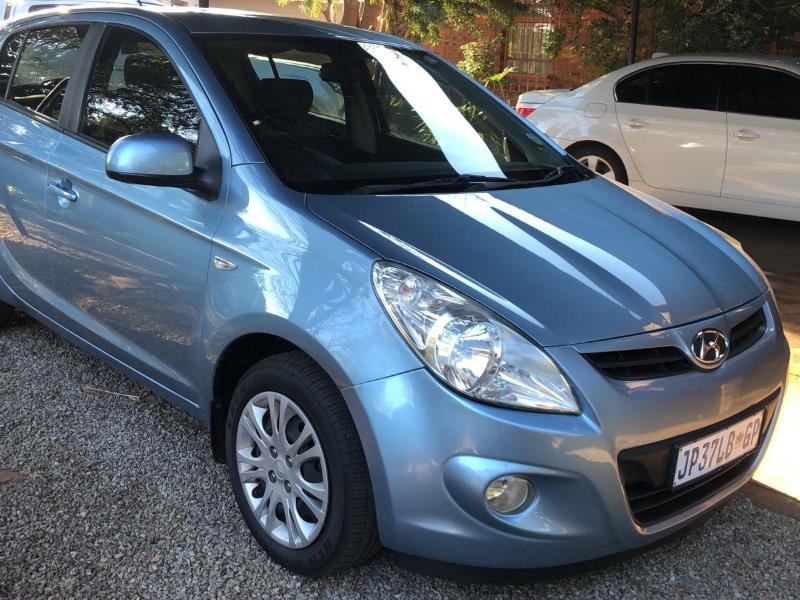
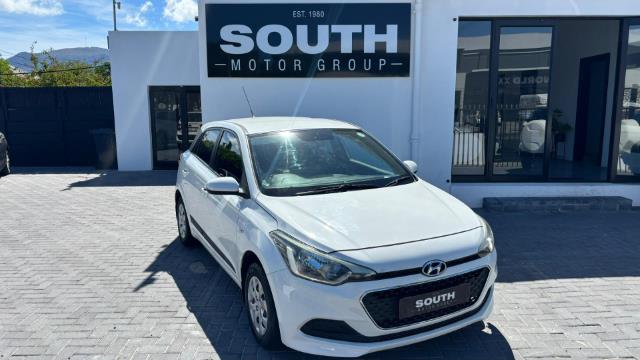
2010 Hyundai i20 1.4 GL Auto

Used Car - 128 000 km - Automatic - Petrol - Easy Cars Randburg, Northcliff, Randburg

Car Image

You're getting a Bad deal! This car is priced 28.7% higher compared to other cars

Asking Price

R 119 900

This car is priced 28.7% higher than the average retail value of this make and model.

Average Retail Value

R 93,157.00

The average price of all cars listed of the same brand and model.

2010 Hyundai i20 1.4 GL Auto Price Comparison

Understanding the Price vs. Kilometers Done Scatter Plot

This chart helps you see how the price of cars compares to how much they’ve been driven.

  • Each Dot: Represents a car similar to the one you’re looking at.

    • Horizontal Line (X-axis): Shows the number of kilometers the car has been driven.
    • Vertical Line (Y-axis): Shows the price of the car.
  • Red Triangle: Highlights the car you’re currently viewing.

What This Means for You:

  • Lower Left Area: Cars that are cheaper and have been driven less.
  • Middle Area: Cars that have a typical balance between price and kilometers driven.
  • Upper Right Area: Cars that are more expensive and have been driven more.

Red Triangle Placement:

  • If the red triangle is towards the lower left: Your car is a great deal—priced lower and driven fewer kilometers than most similar cars.
  • If the red triangle is in the middle: Your car is priced and driven similarly to other cars.
  • If the red triangle is towards the upper right: Your car is priced higher and has been driven more than most similar cars.

This visualization helps you quickly understand how your car stacks up in terms of price and usage, making it easier to make informed decisions.
Understanding the Price Distribution Histogram

This chart shows how the prices of cars similar to the one you’re viewing are spread out.

  • Each Bar: Represents a range of prices (e.g., R 4,900,000 – R 5,000,000) and how many cars fall into that range.
  • Red Highlighted Bar: Indicates the price range of the current car you’re looking at.

What This Means for You:

  • Red Bar on the Left: Your car is priced lower than most similar cars.
  • Red Bar in the Middle: Your car is priced similarly to other cars.
  • Red Bar on the Right: Your car is priced higher than most similar cars.

This helps you quickly see where your car stands in the market and make informed decisions.

More 2010 Hyundai i20 1.4 GL Auto Details

Performance Specs

  • Engine: 1.4-liter, 4-cylinder petrol engine
  • Power Output: 74 kW (99 horsepower)
  • Torque: 136 Nm
  • Transmission: 4-speed automatic
  • 0-100 km/h: Approximately 12.6 seconds
  • Fuel Economy: Estimated 7.5 liters per 100 km combined

Ownership Costs & Maintenance

  • Average Annual Service Costs: R3000 – R5000
  • Insurance Cost: Approximately R800 – R1200 per month depending on the provider and coverage options
  • Fuel Costs: Depending on usage, fuel costs can range significantly based on current petrol prices
  • Common Replacement Parts:
    • Brake pads: R600 – R1200
    • Battery: R900 – R1500
    • Windscreen Wipers: R200 – R400
  • Depreciation: On average, Hyundai cars depreciate about 40% within the first five years

Car Comparisons

  • Volkswagen Polo Vivo – Similar size, but generally lower in power and slightly more fuel efficient
  • Toyota Yaris – Comparable in size and engine capacity, typically has a higher resale value and slightly better perceived reliability
  • Ford Fiesta – Often offers more engaging driving dynamics, but may have higher maintenance costs

Market Insight

  • The Hyundai i20 is known for its good value for money and strong resale value in the South African Market
  • Popular among urban drivers due to its compact size and efficient handling in city traffic
  • Competitively priced in the used car market, making it an attractive option for first-time buyers and small families
  • Recent increases in fuel prices and economic downturns have accentuated the demand for fuel-efficient and affordable vehicles like the i20

Finance Calculator


Monthly Payments: R 2 194,78

Total Interest: R 50 113,97

Total Payment: R 158 023,97

* Please note that these calculations are only estimates and must be confirmed with your finance provider.

Frequently Asked Questions

How do you calculate the value of the cars listed?

We use an algorithm that analyzes various data points, including market trends, mileage, car condition, and historical prices for similar models. This helps us determine a fair market value and compare it to the listed price

The charts compare the car’s current price with average prices for similar models. You can see trends for different factors like the car’s age, mileage, and condition. This visual tool helps you understand whether the listing price is above or below the market average.

The price is influenced by the car’s make, model, year, mileage, condition, and location. Additionally, supply and demand in the used car market can cause price fluctuations. Please note that we don’t set the price, but the seller does.

Our pricing data is updated daily to ensure accuracy. We continuously track listings and sales across multiple platforms to keep our data current.

We provide a comparison between the car’s listing price and its market value based on similar models. If the listing price is below the market value, it may indicate a good deal. We also highlight the price difference on the page combined with a label Good, Bad, or Fair.

The mileage data is provided by the seller. We recommend verifying the mileage during the inspection and checking the car’s service history for any inconsistencies.

We don’t directly offer financing, but we provide links to trusted third-party partners that can assist with financing options tailored to your needs.

If you have any concerns about a specific car listing, such as suspicious pricing or inaccurate information, you can report it to our team, and we will investigate further.

Related Cars